
What is EcorisMap?
EcorisMap is an application for recording and checking location information using smartphones and tablets during field surveys and other outdoor activities.
Main features:
- Display and record location information on maps.
- Load maps published in tile format and PDF maps created by users.
- Import GeoJSON, GPX, KML, and CSV format data, and set labels and colors.
- Customize items to record with location information, supporting various form formats such as lists and checkboxes.
- Export recorded data in GeoJSON, GPX, and CSV formats.
- Output location information and maps in PDF format.
- Use offline mode in environments without internet connection.
Website: https://ecoris-map.web.app
Terms of Service: https://ecoris-map.web.app/terms_en.html
Quick Start
Main Screens
| Home | Add Feature | Map Selection | Map Settings |
|---|---|---|---|
 |
 |
 |
 |
| Layer List | Layer Settings | Data | Data Editing |
|---|---|---|---|
 |
 |
 |
 |
Usage Steps
A. Preparing the Map
- Tap the "Map Selection" button on the Home screen.
- Select the map you want to display on the Map Selection screen.
- To add a new map, either add a new "Map Settings" or select from the existing settings list.
- For offline use, download the necessary maps in advance.
B. Preparing Display Data
- Tap the "Layer List" button on the Home screen.
- Tap the "Import" button and import the data you want to display (GeoJSON, GPX, KML, CSV formats).
- Change the data style (color, etc.) as needed.
- To display labels, select the field name to use.
C. Setting Up Recording Layers
- On the Layer List screen, tap the "Add New" button to create a layer for data recording.
- On the Layer Settings screen, set the layer name, style, fields, and save.
- To edit existing layers, tap the "Settings" button of the target layer to edit.
D. On-site Use
- Turn on your device's GPS function and move to your current location.
- For offline use, switch to "Offline Mode" on the Map Selection screen.
- To record tracks:
- Tap the "Track" button to start recording.
- Tap again to end recording.
- To record location information:
- Switch the target layer to edit mode on the Layer List screen.
- On the Home screen, select the "Add Current Location" button or drawing tools to add points, lines, or polygons.
- Enter field values on the Data Editing screen and save.
E. Exporting Data
- Select the desired layer from the Layer List screen to display the data.
- Select the data you want to export and tap the "Export" button.
Basic Operations
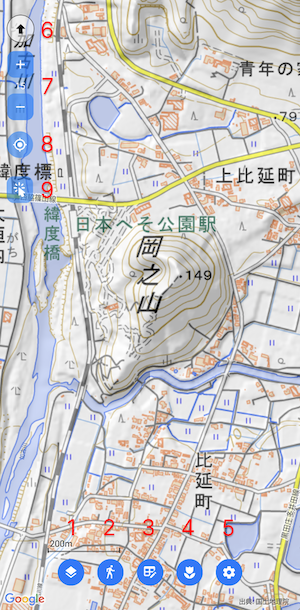
Home Screen
The Home screen is where you operate the map display and various function buttons.
(1) Map Selection Button
Opens the Map Selection screen.
(2) Track Recording
- Tap the Track button to start recording.
- Tap again to end recording.
- Tracks are recorded in the line-type layer that is in edit mode.
(3) Layer List Button
Opens the Layer List screen.
(4) Draw Tool Selection
Displays tools for adding and editing points, lines, polygons, and map memos.
(5) Settings Button
Opens the Settings screen.
(6) Compass
Switches the map display direction:
- North Up (North direction at the top)
- Heading Up (Travel direction at the top)
(7) Zoom
- Change the map scale with buttons.
- Scale can also be changed by pinching in/out on the screen.
(8) GPS
- Tap to activate GPS and display current location.
- Enters current location follow mode when activated.
- Follow mode is canceled when the map is dragged.
- Tapping in follow mode turns GPS OFF.
- Tapping the current location marker displays coordinates and accuracy.
- Current location marker color changes based on accuracy:
- Red: accuracy ≤ 10m
- Orange: 10m < accuracy ≤ 15m
- Gray: accuracy > 15m
(9) Display Attribute Information
- Displays attribute information of features.
- Display options: All, Points only, Lines only, Polygons only
- Long press the button to redisplay the selection screen.
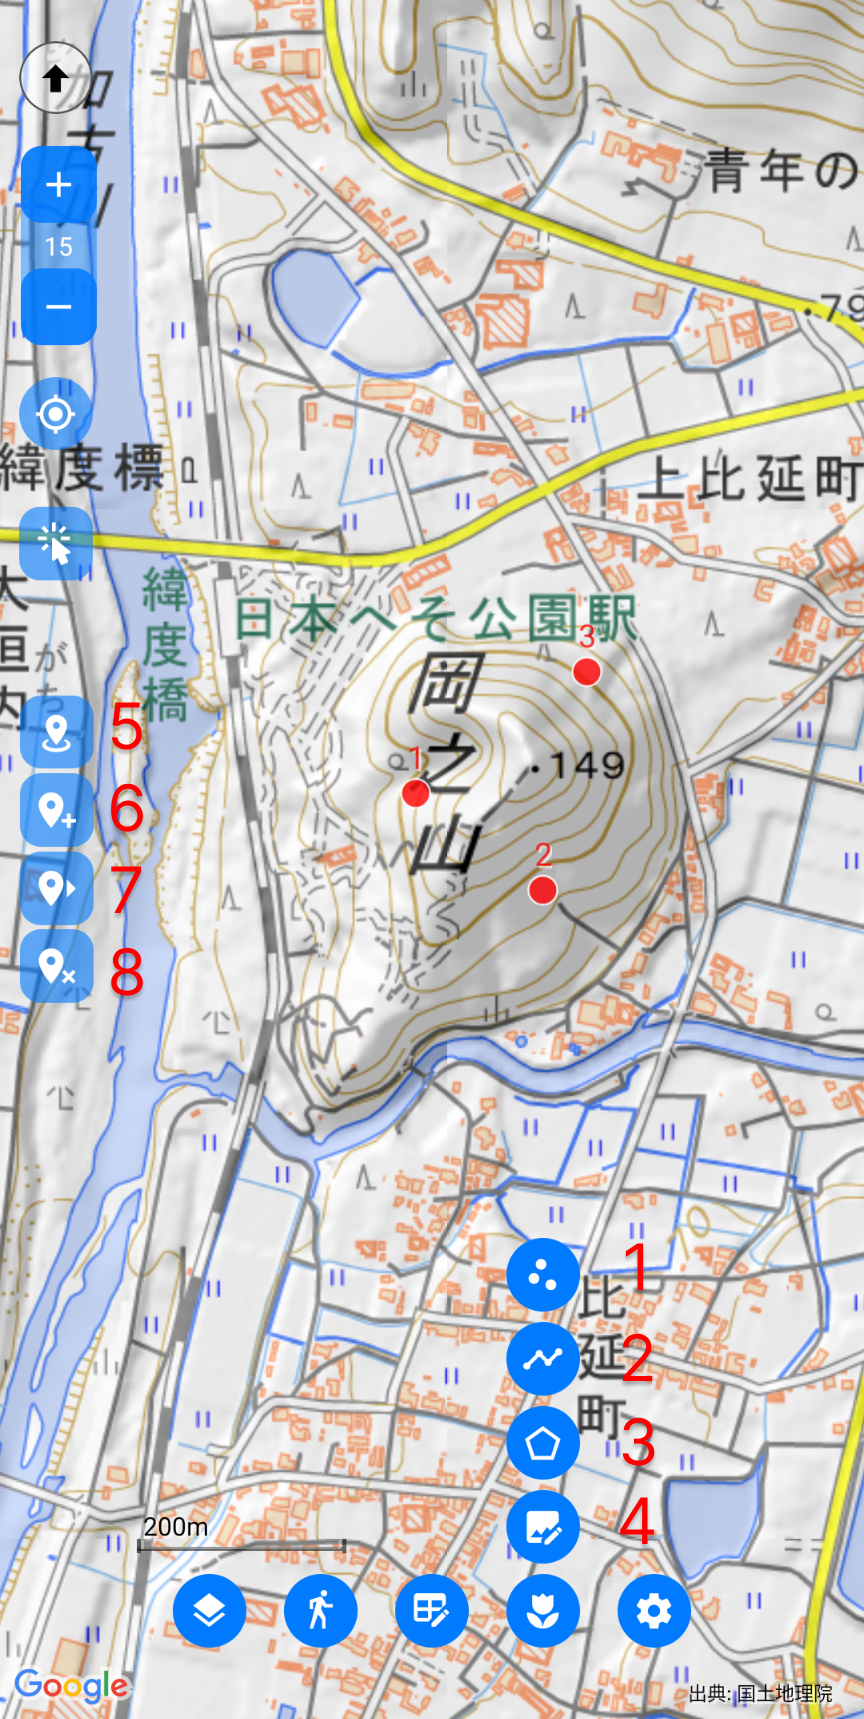
Map Selection
The Map Selection screen is where you switch and set the maps to display.
(1) Map Display
- Switch map display.
- Maps with transparency settings can be overlaid on the map below.
- Change the order of overlays with the button on the right edge.
(2) Map Name
For PDFs, tapping the map name jumps to the map extent.
(3) Map Settings Button
Opens the Map Settings screen.
(4) Download Button
- Opens the download screen for offline use.
- For PDFs, downloads and loads the PDF from the server.
(5) Import Maps and Settings
- Import PDF or PMTiles format maps stored on the device.
- Import map settings saved in (7).
(6) Add Map Settings Button
Opens the screen to add new map settings.
(7) Export Map Settings
Exports map settings.
(8) Toggle Offline Mode
- Switches between offline and online modes.
- Offline Mode: Displays maps loaded from cache that were previously downloaded.
- Used in locations without internet connection.
(9) Group Expand/Collapse Button
Show/hide maps within the group.
(10) Map Order Change Button
- Manages the order of maps and groups.
- Maps higher in the list are displayed on top.
- Group operations:
- If directly under a group: Tap to enter the group.
- If at the top within a group: Tap to exit the group.
Map Download
This is the screen for downloading maps for offline use.
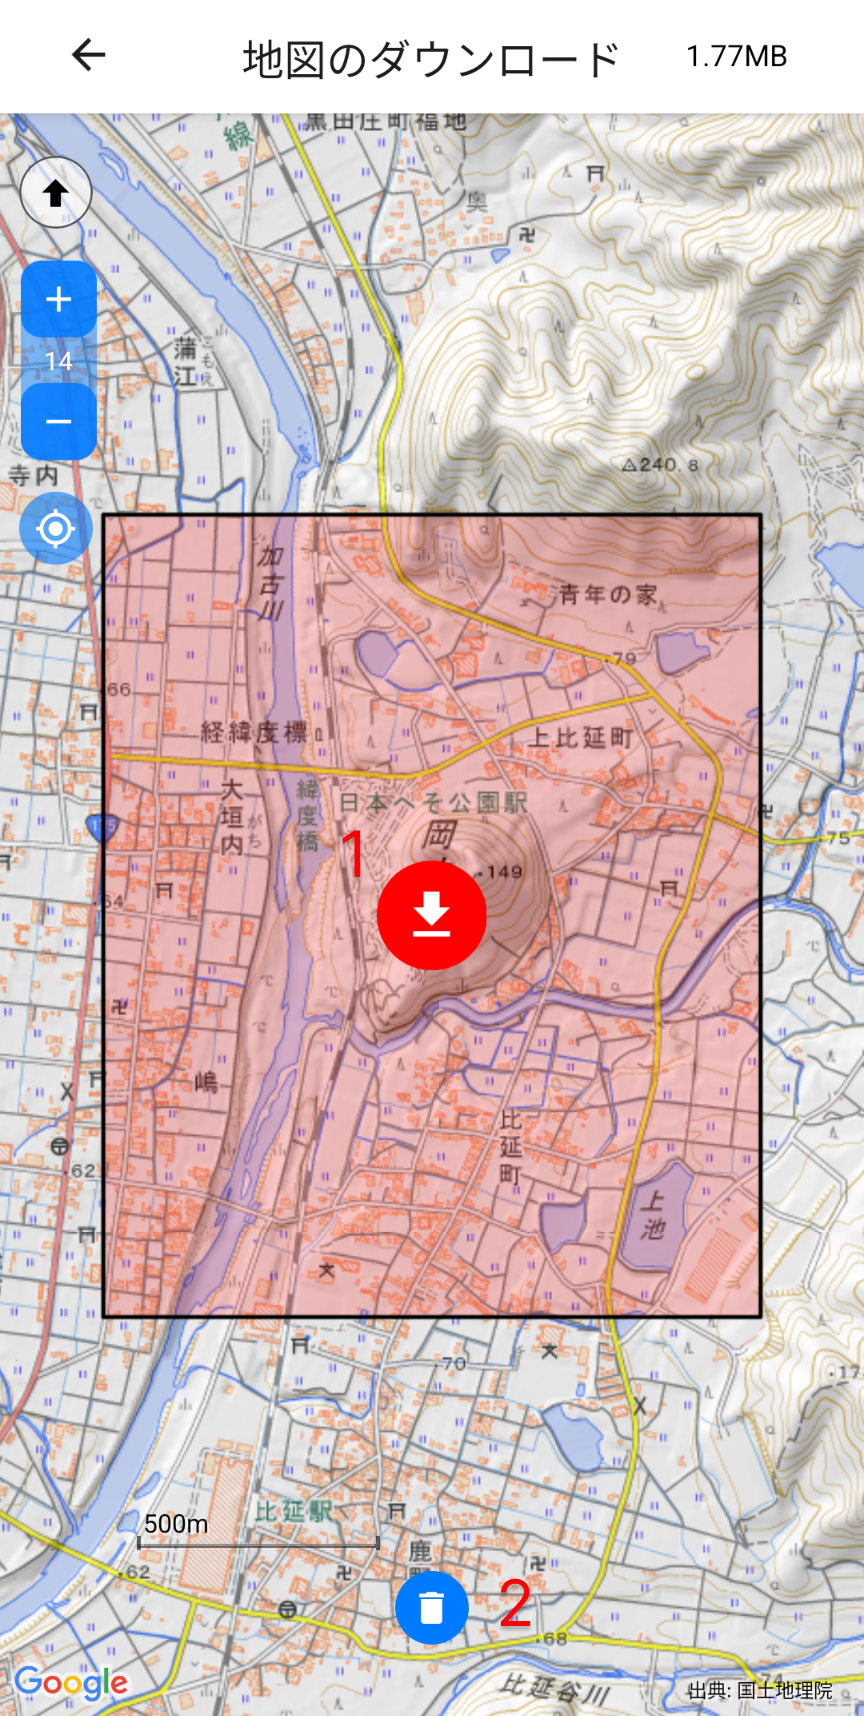
(1) Map Download
- Move to the necessary area and range and tap the download button.
- Maps covering that area for zoom levels 0-16 (0-18 for vector tiles) will be downloaded.
- The download button is displayed at zoom levels 11-14.
(2) Delete Map
- Deletes downloaded maps.
- Downloaded areas are displayed in orange.
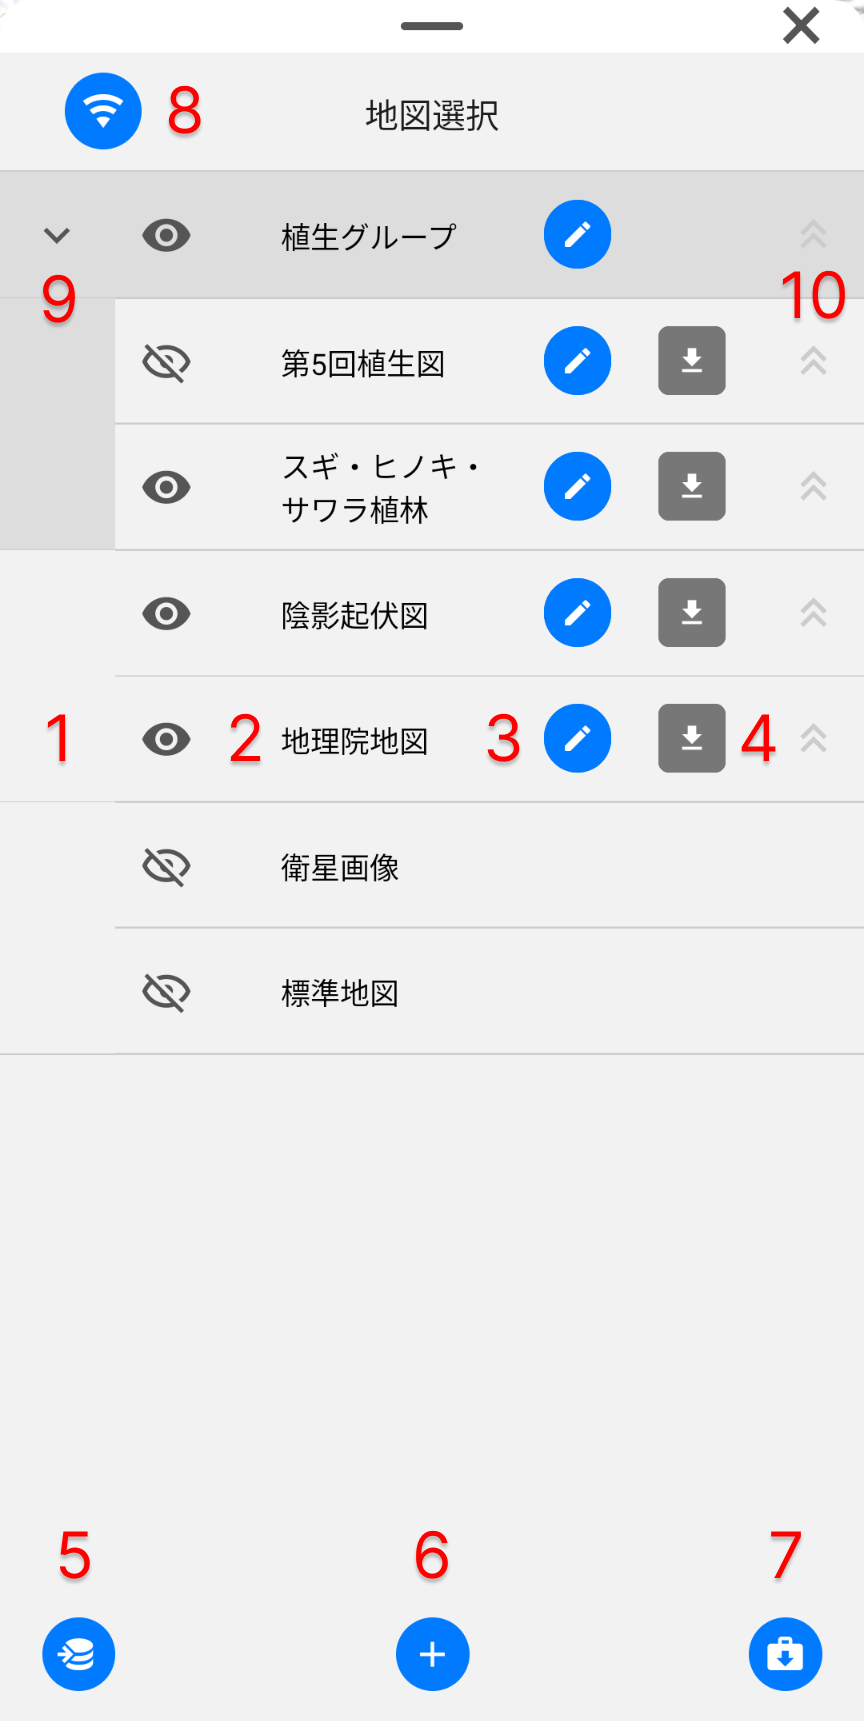
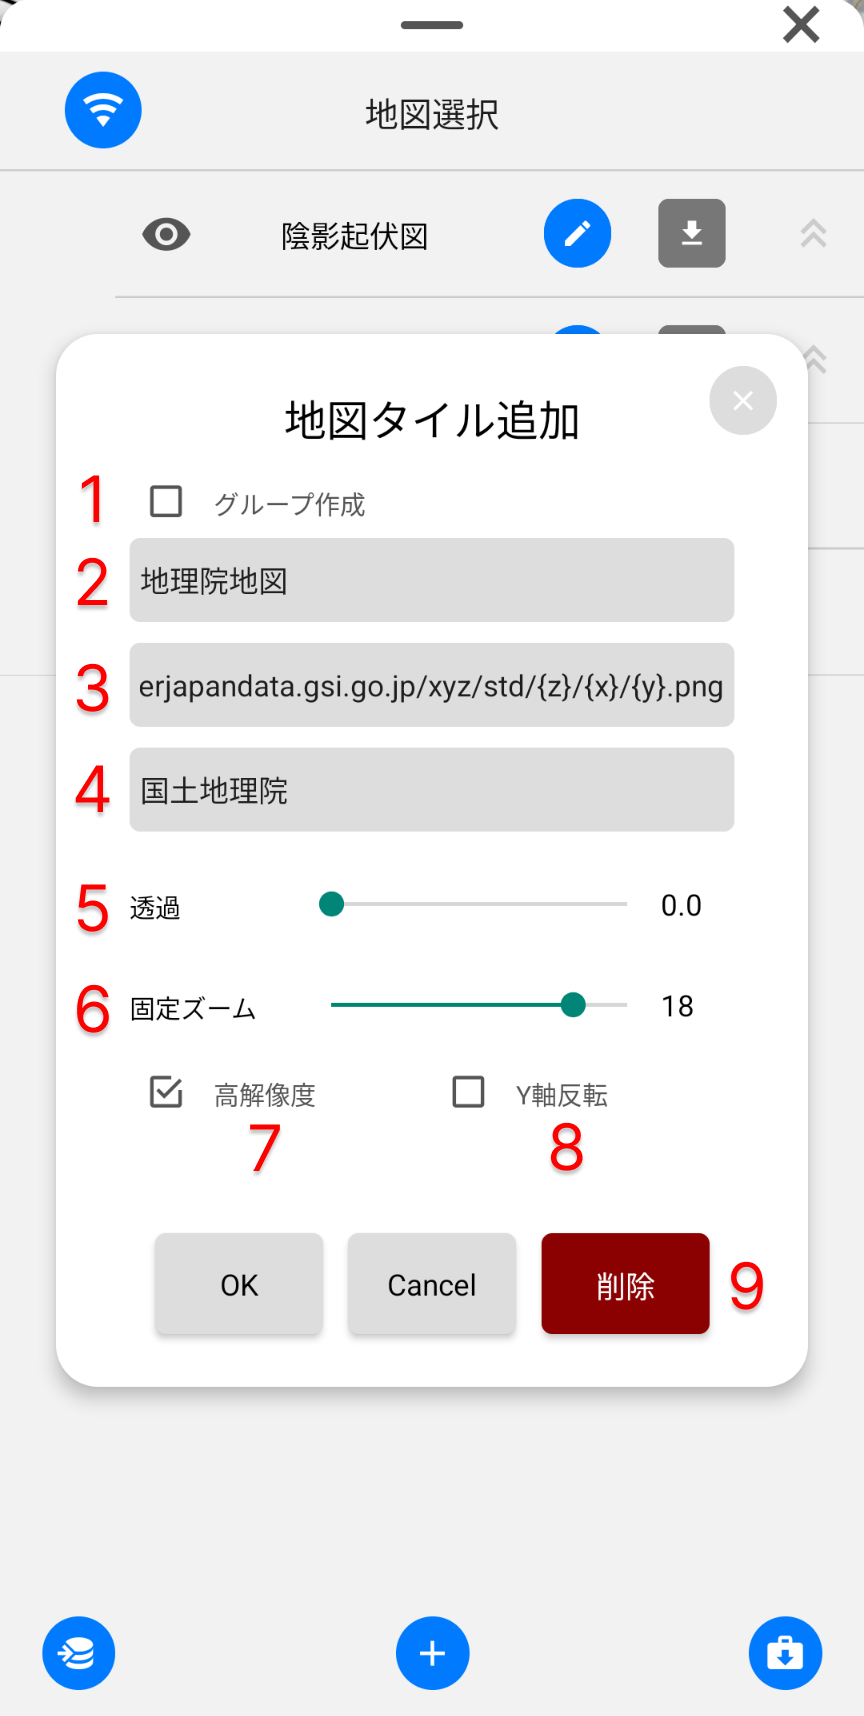
Map Settings
This is the screen for registering maps and configuring display settings.
Addable maps: Map tiles (XYZ images, PMTiles), Vector tiles (pbf, PMTiles), PDF (with location information)
(1) Create Group
Check this if you want to create a group.
(2) Map Name
(3) Map Tile URL
- Format:
https://example/{z}/{x}/{y}.png - Vector tiles:
- pbf format:
https://example/{z}/{x}/{y}.pbf - pmtiles format:
https://example/sample.pmtilesorpmtiles://https://example/sample - When loaded from device:
pmtiles://file://example.pmtiles - For raster format: Uncheck "Vector tile"
- pbf format:
- PDF:
https://example/sample.pdf- When loaded from device:
file://sample.pdf
Note: When using externally published maps, please check the terms of use.
(4) Source Attribution
Please attribute the source according to the map's terms of use.
(5) Transparency Setting (0: opaque ~ 1: transparent)
- Maps with transparency settings can be overlaid on the map below.
- Example: Used when overlaying hill-shade maps.
(6) Fixed Zoom
Displays an enlarged fixed zoom level map for zoom levels larger than this value.
(7) High Resolution
Displays the map at the next zoom level. Example: When you want to display a detailed map over a wide area on the GSI standard map.
(8) Y-axis Inversion
- Check when loading TMS tiles (Y-axis origin at bottom).
- Default is XYZ tiles (Y-axis origin at top).
(9) Delete Settings
Deletes map settings.
(10) Vector Tile Style
- Style file can be specified when vector tiles are specified in the map tile URL.
- Style file: Conforms to the layers item of the MapLibre Style Spec (only basic items supported).
- For supported styles, refer to style_sample.
- If no style file is specified: Displayed with default settings.
- It's also possible to load style files saved on the device.
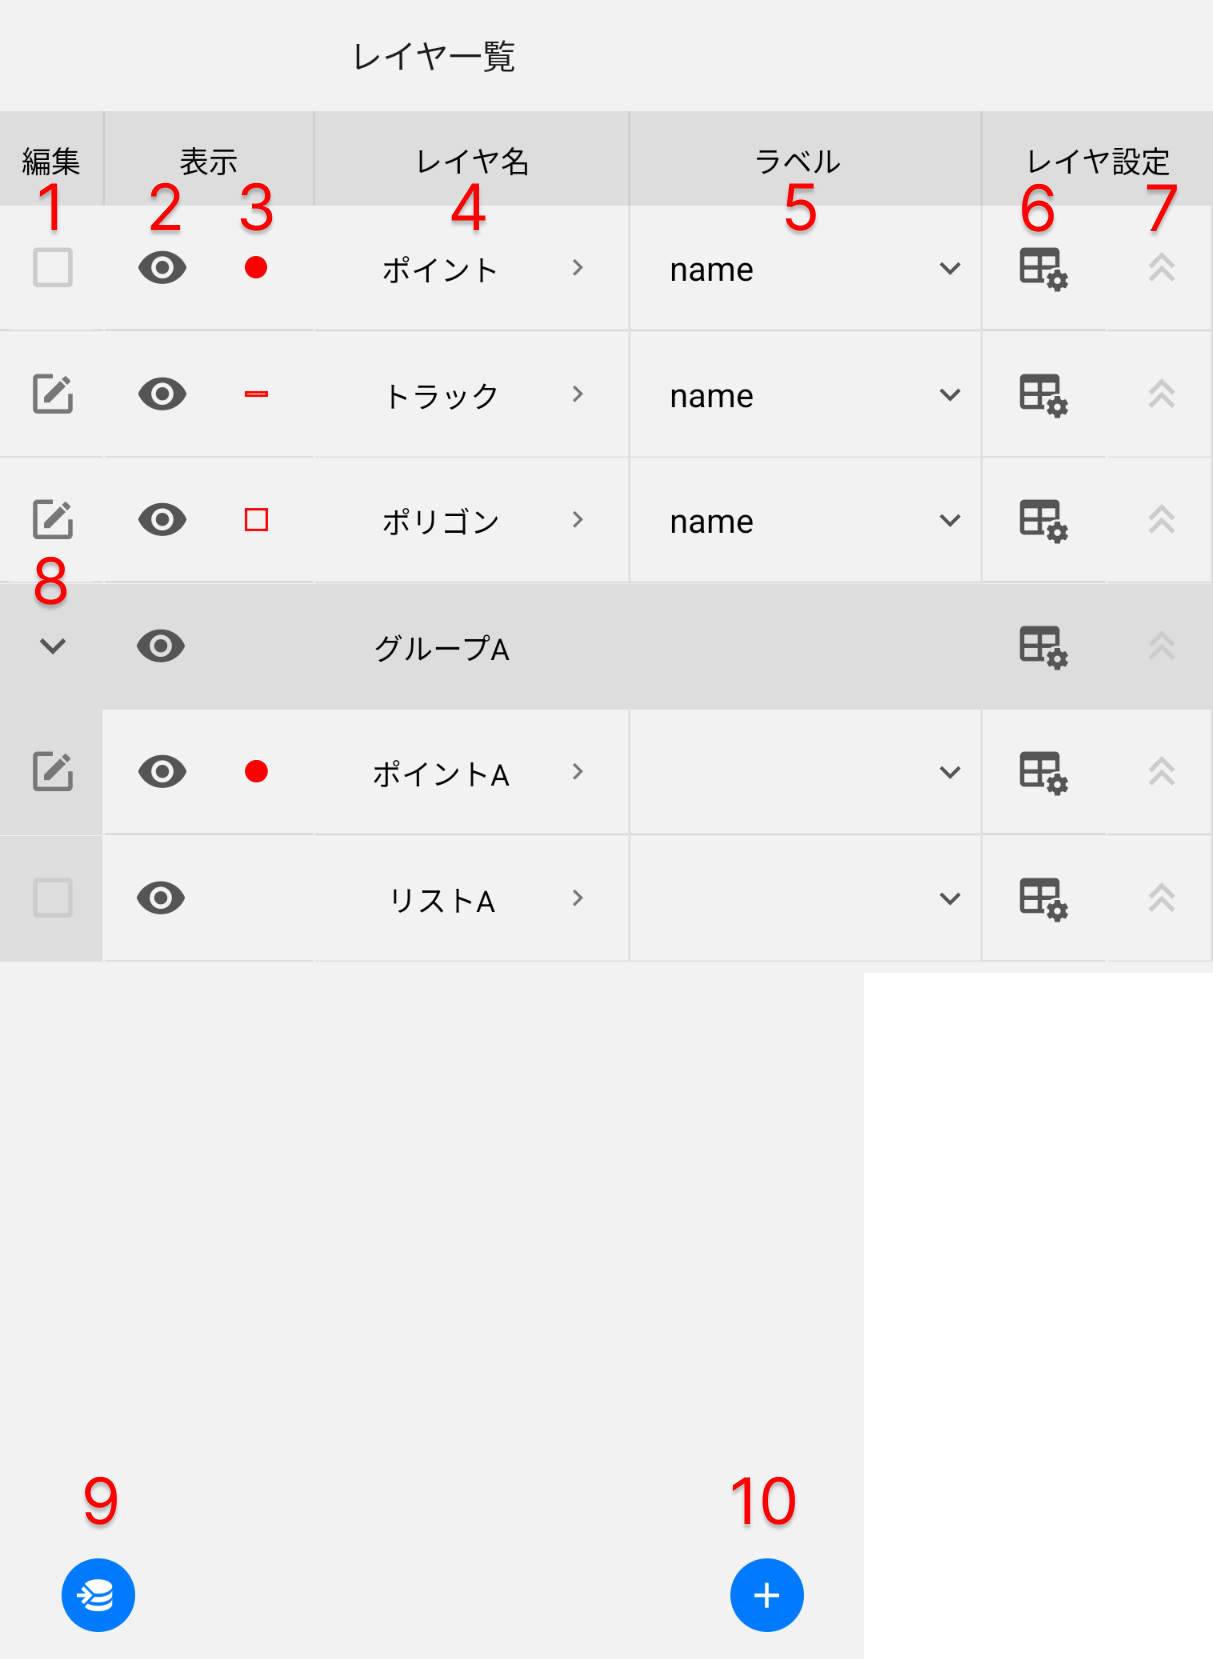
Layer List
The Layer List screen displays a list of layers and provides access to data and layer settings.
(1) Edit Checkbox
- Select layers to put in edit mode.
- Layers of the same type (points or lines) cannot be in edit mode simultaneously.
(2) Display Toggle Button
Toggles the display/hide of layer data.
(3) Style Button
Opens the layer style settings screen.
(4) Data Confirmation
Tap the layer name to open that layer's data screen.
(5) Label Settings
- Select the field name to display as a label.
- When "Custom" is selected: Can create labels combining field values.
- Format: Field1|Field2
(6) Layer Settings Button
Opens the layer settings screen.
(7) Layer Order Change Button
- Changes the order of layers.
- Group layer operations:
- Just below a group: Tap to enter the group.
- At the top within a group: Tap to exit the group.
(8) Group Open/Close Button
Show/hide layers within the group.
(9) Data Import Button
- Supported formats: GeoJSON, GPX, KML, CSV
- GeoJSON: Supports latitude/longitude points, lines, polygons.
- GPX: Supports waypoints, tracks.
- CSV:
- Default: Loaded as data without location information.
- With WKT format coordinates in the geometry column, it becomes location-aware.
- For web version, import is also possible by dragging and dropping files onto the map.
(10) Add Layer Settings Button
Opens the layer settings screen to add a new layer.
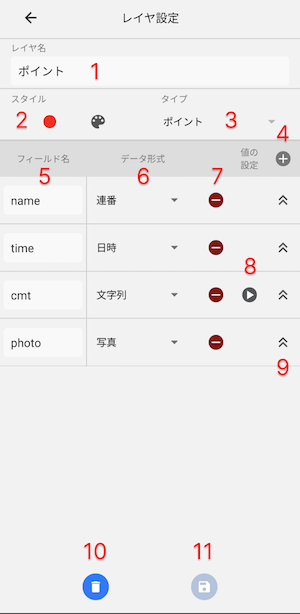
Layer Settings
The Layer Settings screen is where you set the layer name, type, and data fields.
(1) Layer Name
Enter the layer name.
(2) Style Settings Button
Opens the style settings screen.
(3) Type Selection
- Selectable types:
- Point
- Line
- Polygon
- No location information (for recording data without location information)
- Layer group (for organizing multiple layers)
(4) Add Field Button
Adds a new field.
(5) Field Name
Enter the field name.
(6) Data Format
- Supported formats:
- String, Serial number, Date/Time, Date, Time, Time range
- Integer, Decimal, Numeric range
- List, Radio button, Check button
- Photo, Table, List table, Reference
(7) Delete Field Button
Deletes the field.
(8) Set Default Values, List Items
- String, Integer fields: Set default values.
- List, Radio button, Check button, Table, List table: Set candidate values.
(9) Display Order Change Button
Changes the display order of fields.
(10) Delete Layer Button
Deletes the layer and its data.
(11) Save Settings
Saves changes to layer settings.
Style Settings
The Style Settings screen is where you set the style (color) of the layer.
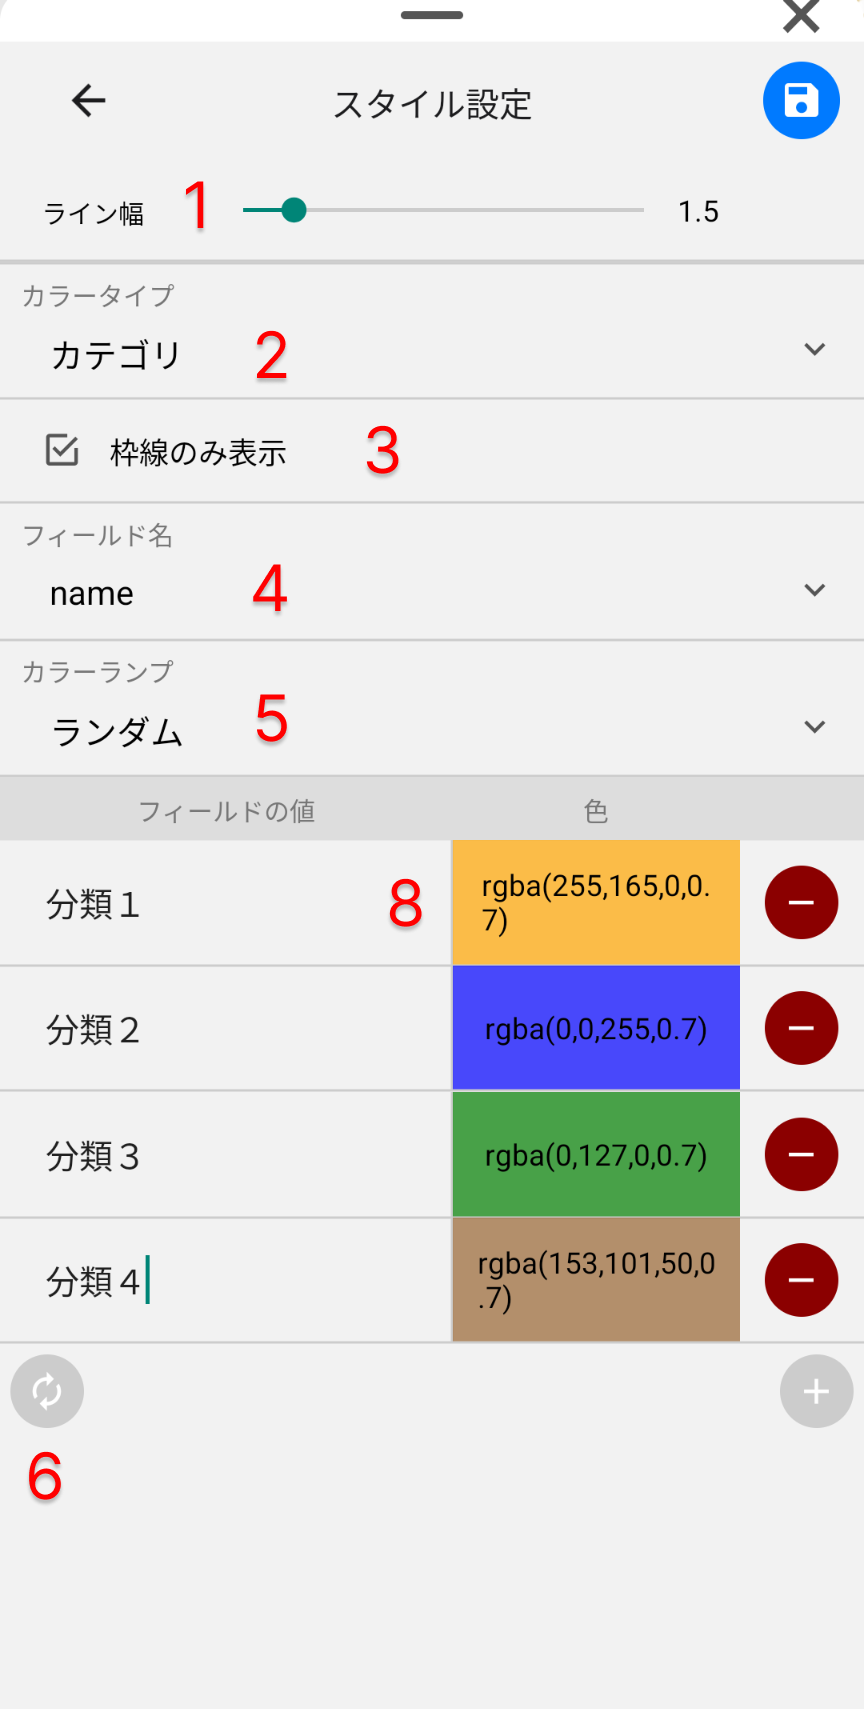
(1) Line Width
Specifies the width of lines and polygon outlines.
(2) Color Type
- Selectable types:
- Single color
- Category (color by field value)
- Individual (for map memo function)
(3) Display Outline Only
- Check to display only the outline of polygons
(4) Field Name
- Select when Color Type is "Category" or "Individual".
- When "Custom" is selected: Can specify colors by combining field values.
- Format: Field1|Field2
(5) Color Ramp
Method for automatic color setting when Color Type is "Category".
Currently only supports random.
(6) Auto Fetch Button
When Color Type is "Category":
- Automatically fetches field values.
- Sets colors according to the color ramp.
- Custom field: Automatically fetches combinations of entered field values.
(7) Add Color Button
When Color Type is "Category": Manually add colors for field values.
(8) Color Setting
Select color with color picker.
(9) Delete Color Setting Button
Deletes color settings for fields.
Field Value Settings
The Field Value Settings screen is where you set default values for fields and candidate values for lists and checkboxes.

(1) Value
Enter default values or values for lists and checkboxes.
(2) Add Value Button
Adds a new value.
(3) Add "Other" Value
Adds an "Other" value.
(4) Delete Value Button
Deletes the value.
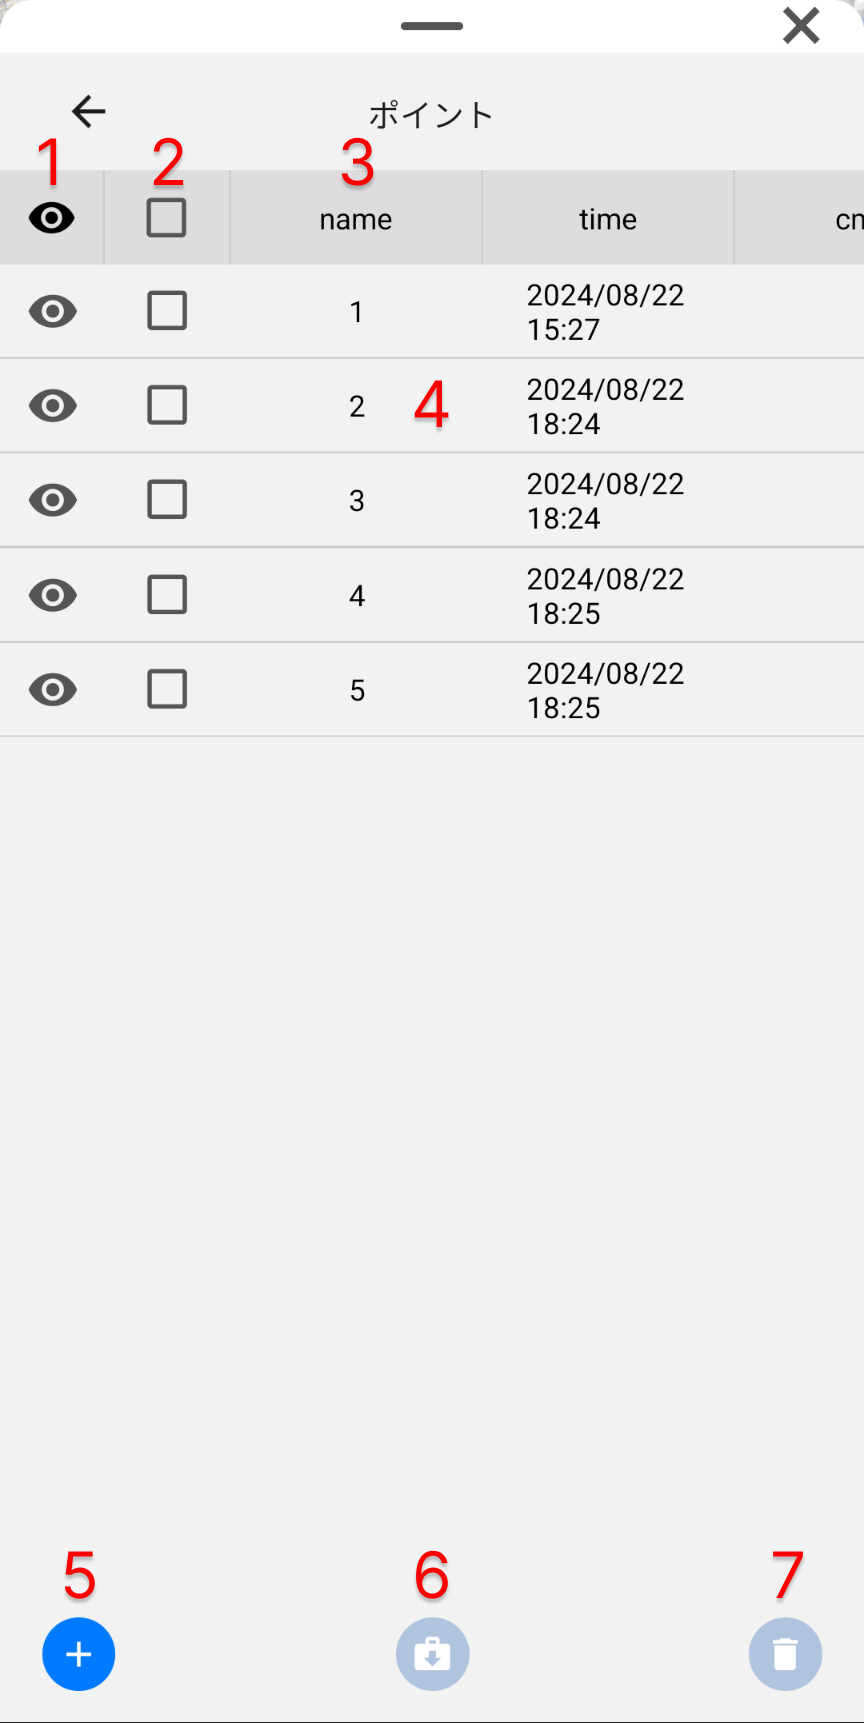
Data
The Data screen displays a list of data and provides access to and operations on each data item.
(1) Display Toggle Button
- Toggles the display/hide of data.
- Header button: Toggles all data at once.
(2) Data Selection Checkbox
- Select data for deletion or export.
- Header checkbox: Select all data at once.
(3) Change Ascending/Descending Order
- Tap field name: Change ascending/descending order of data display.
- Long press & drag data: Manually reorder data.
(4) Data Input/Editing
Tap data to open the editing screen.
(5) Add Data Button
Adds new data (default coordinate value: 0,0).
(6) Export Button
Exports selected data.
(7) Delete Button
Deletes selected data.
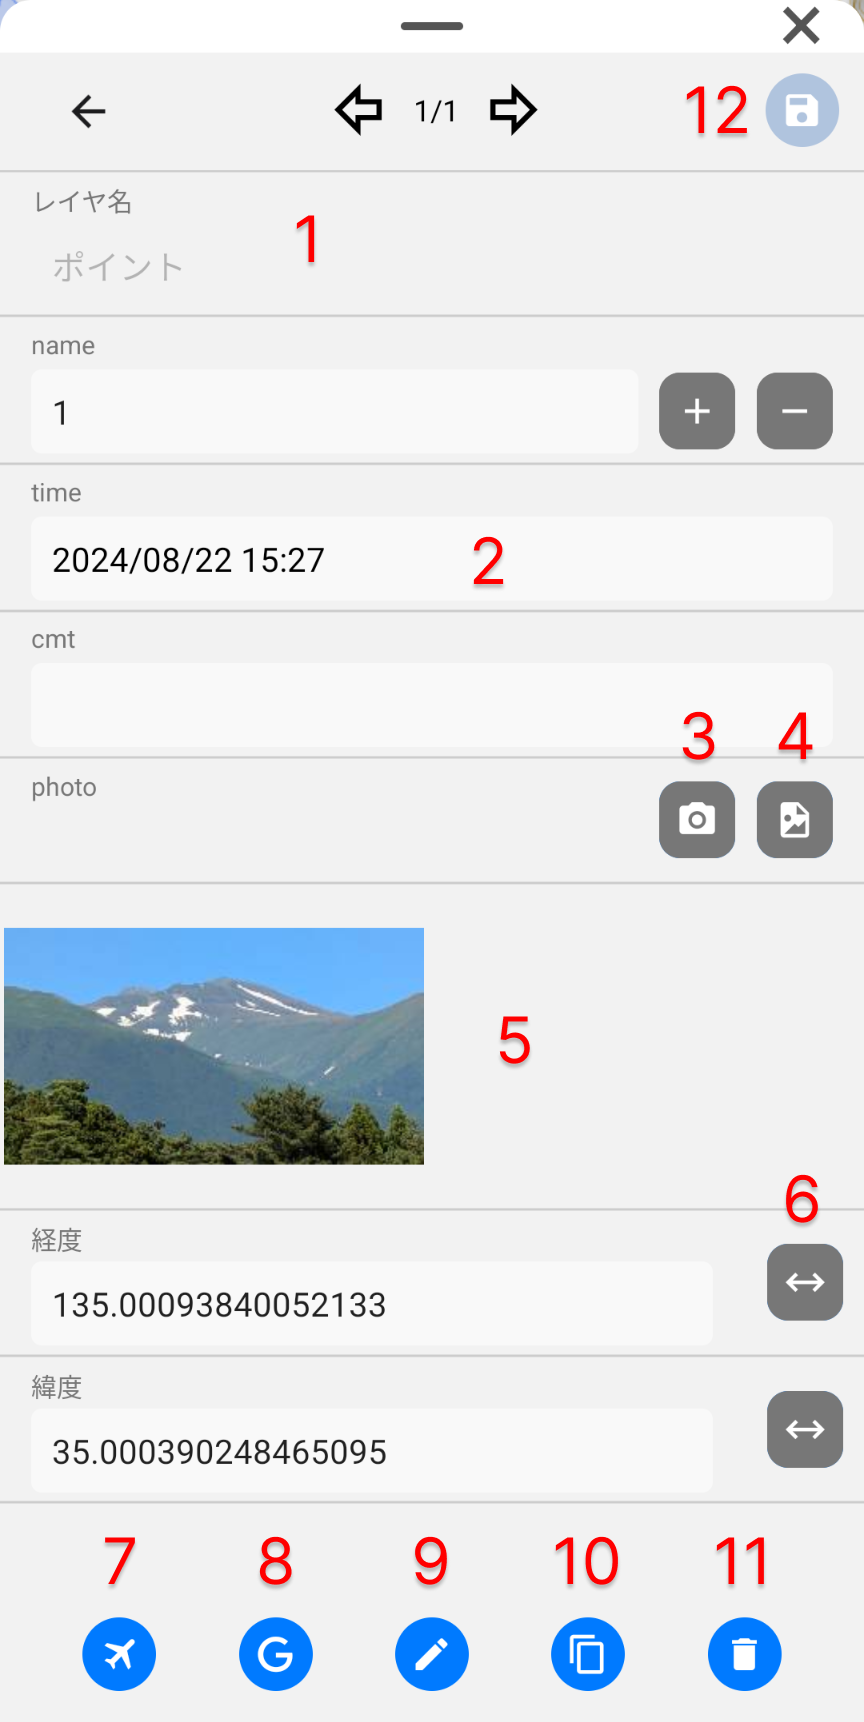
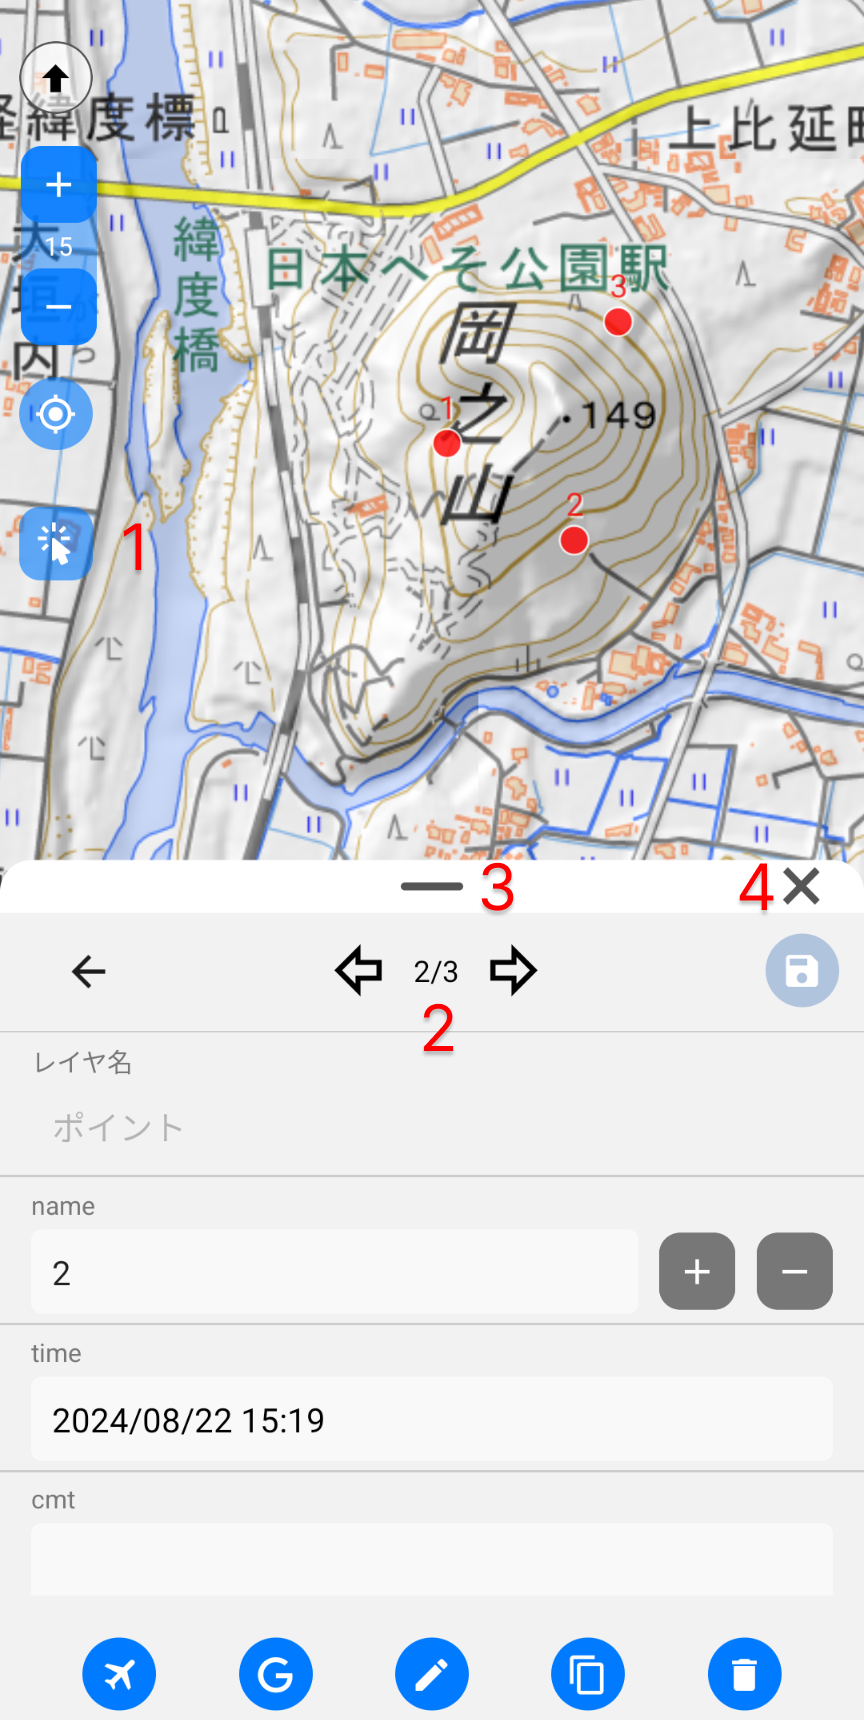
Data Editing
The Data Editing screen is where you input and edit data.
(1) Layer Name
Displays the name of the layer to which the data belongs.
(2) Fields
Enter/select values according to the field type.
(3) Take Photo Button
Takes a photo.
(4) Select Photo Button
Selects an existing photo.
(5) Photo Display/Delete
- Tap: Enlarges photo display.
- Photo deletion is also possible.
(6) Coordinate Display Toggle Button
Toggles coordinate display between decimal and sexagesimal.
(7) Move to Data Button
Moves to the data location on the map.
(8) Google Maps Button
Displays the data location in Google Maps (useful for route information).
(9) Edit Location Information Button
Edits the data's location information.
(10) Duplicate Button
Duplicates data for new addition.
(11) Delete Button
Deletes the data.
(12) Save Button
Saves changes to the data.
Attribute Information Display
Displays attribute information for points, lines, polygons, and vector tiles.
Point, Line, Polygon Information
(1) Information Display Button
Select and tap a feature to display attribute information.
(2) Data Switch Button
Displays the next data in the same layer.
(3) Change Display Area
Adjust the display area by swiping.
(4) Close Button
Closes the display screen and returns to the Home screen.
Vector Tile Information
With the information display button off, tapping a vector tile feature displays information in a popup.
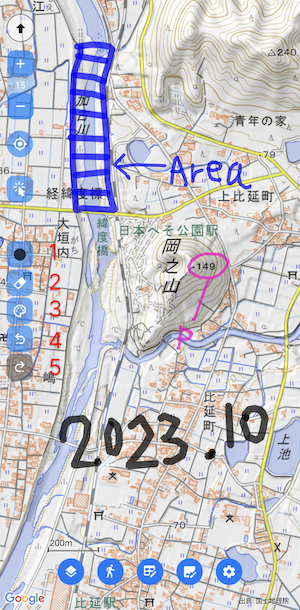
Adding and Editing Location Information
Add and edit points, lines, polygons, and map memos.
(1) Point Tool Display Button
Displays point tools.
(2) Line Tool Display Button
Displays line tools.
(3) Polygon Tool Display Button
Displays polygon tools.
(4) Map Memo Tool Display Button
Displays map memo tools.
Adding and Editing Points
(5) Add to Current Location Button
Adds a point at the current location (tap the screen with GPS on).
(6) Add Point Button
Adds a new point at the tapped location.
(7) Move Point Button
Long press and drag to move a point.
(8) Delete Point Button
Deletes the tapped point.
Adding and Editing Lines, Polygons
| Line | Polygon |
|---|---|
 |
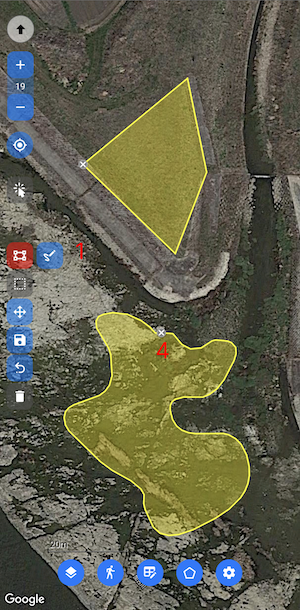 |
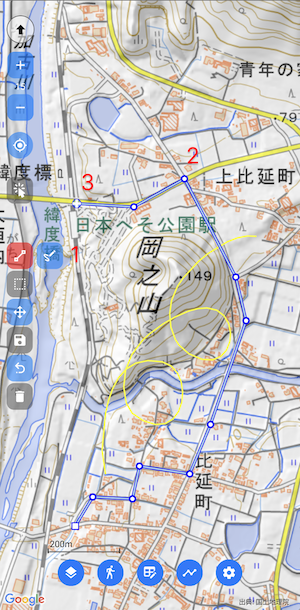
How to Edit Lines and Polygons
There are two types of tools: Plot Tool and Freehand Tool. Long press the button to switch tools.
A. Plot Tool
- Select the line (polygon) you want to edit with the feature selection button. (Steps 1-3 are unnecessary for new creation)
- Switch to the Plot Tool.
- Tap the line you want to edit.
- Tap the screen to plot the line.
- To move existing nodes (2): Drag the node.
- To add a node: Tap on the line.
- To delete a node: Tap the node.
- To end editing: Tap the starting node (3).
- To create a new line: Tap the screen to add new nodes. To edit another line: Repeat steps 3-8. Press the X (4) at the start of the line to exclude from editing.
- To complete editing: Tap the feature save button.
B. Freehand Tool
Steps 1-3 are the same as the Plot Tool
4. Drag on the screen to draw a line.
5. To modify an existing line: Draw over the part you want to modify.
6. To end editing: Tap the starting node (3). For polygons, if the end and start points are apart, it will close with a straight line.
7. To create a new line: Drag on the screen to create a new line. To edit another line: Repeat steps 3-6. Press the X (4) at the start of the line to exclude from editing.
8. To complete editing: Tap the feature save button.
Adding and Editing Map Memos
Add and edit map memos to write notes on the map. Memos are saved in the line-type layer that is in edit mode. When a tool is selected, the layer labels become hidden and the style setting changes to "Individual".
(1) Pen Selection Button
- When selected, you can write memos on the map.
- Long press to select pen thickness.
- To move the map: Turn off selection or tap with two fingers.
(2) Eraser Button
- Select and trace over memos to erase them from the map.
- Lines intersecting with the eraser will be deleted.
(3) Color Selection Button
Select the pen color.
(4) Undo Button
Undo one edit.
(5) Redo Button
Redo one undo.
(6) Draw with Apple Pencil Only Button
- On: Drawing is only possible with Apple Pencil.
- Finger touch is used for moving and zooming the map.
Exporting and Using Memos
- Can be exported from the data screen like normal lines.
- Saved fields:
- _strokeWidth (line width)
- _strokeColor (line color)
- _zoom (zoom level at the time of writing)
Settings
The Settings screen allows you to access various settings and manuals.
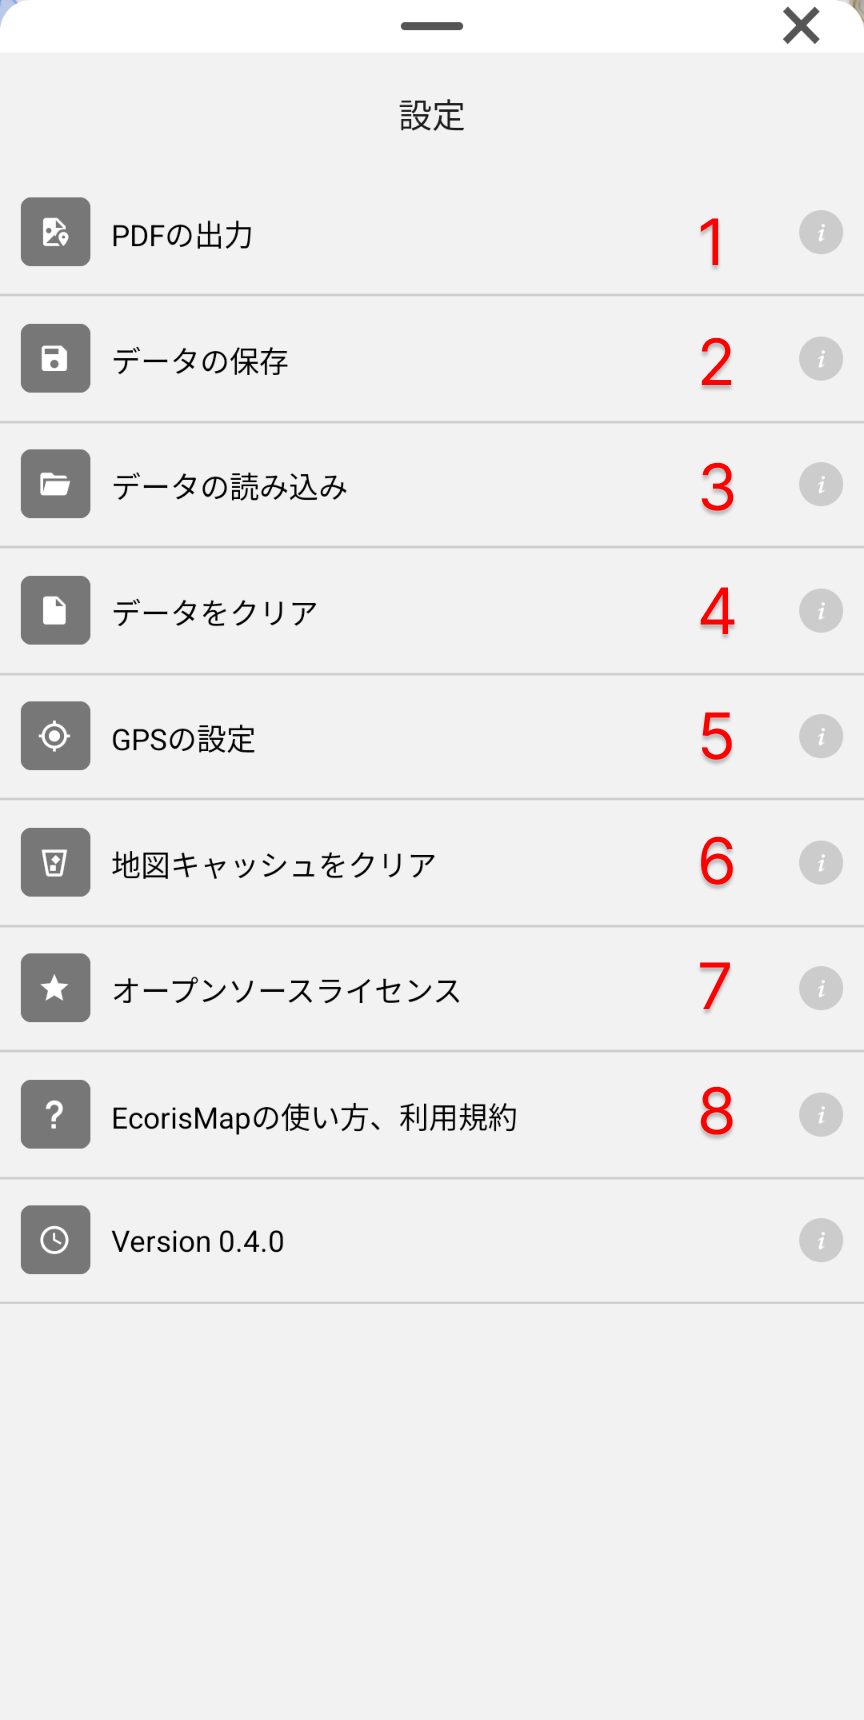
(1) PDF Output
Outputs maps and location information for a specified range to PDF. Data lists can also be output to PDF.
(2) Save Data
Saves current data and settings to an ecorismap format file.
(3) Load Data
Loads saved data and settings from an ecorismap format file.
(4) Clear Data
Clears current data and settings.
(5) GPS Settings
Sets GPS location accuracy. Changing accuracy affects battery consumption.
(6) Clear Map Cache
Clears map cache and downloaded files.
(7) Open Source Licenses
Displays licenses for open source software used in the app.
(8) How to Use EcorisMap, Terms of Service
Displays how to use (this site) and terms of service.
(9) Version
Displays version and change history.
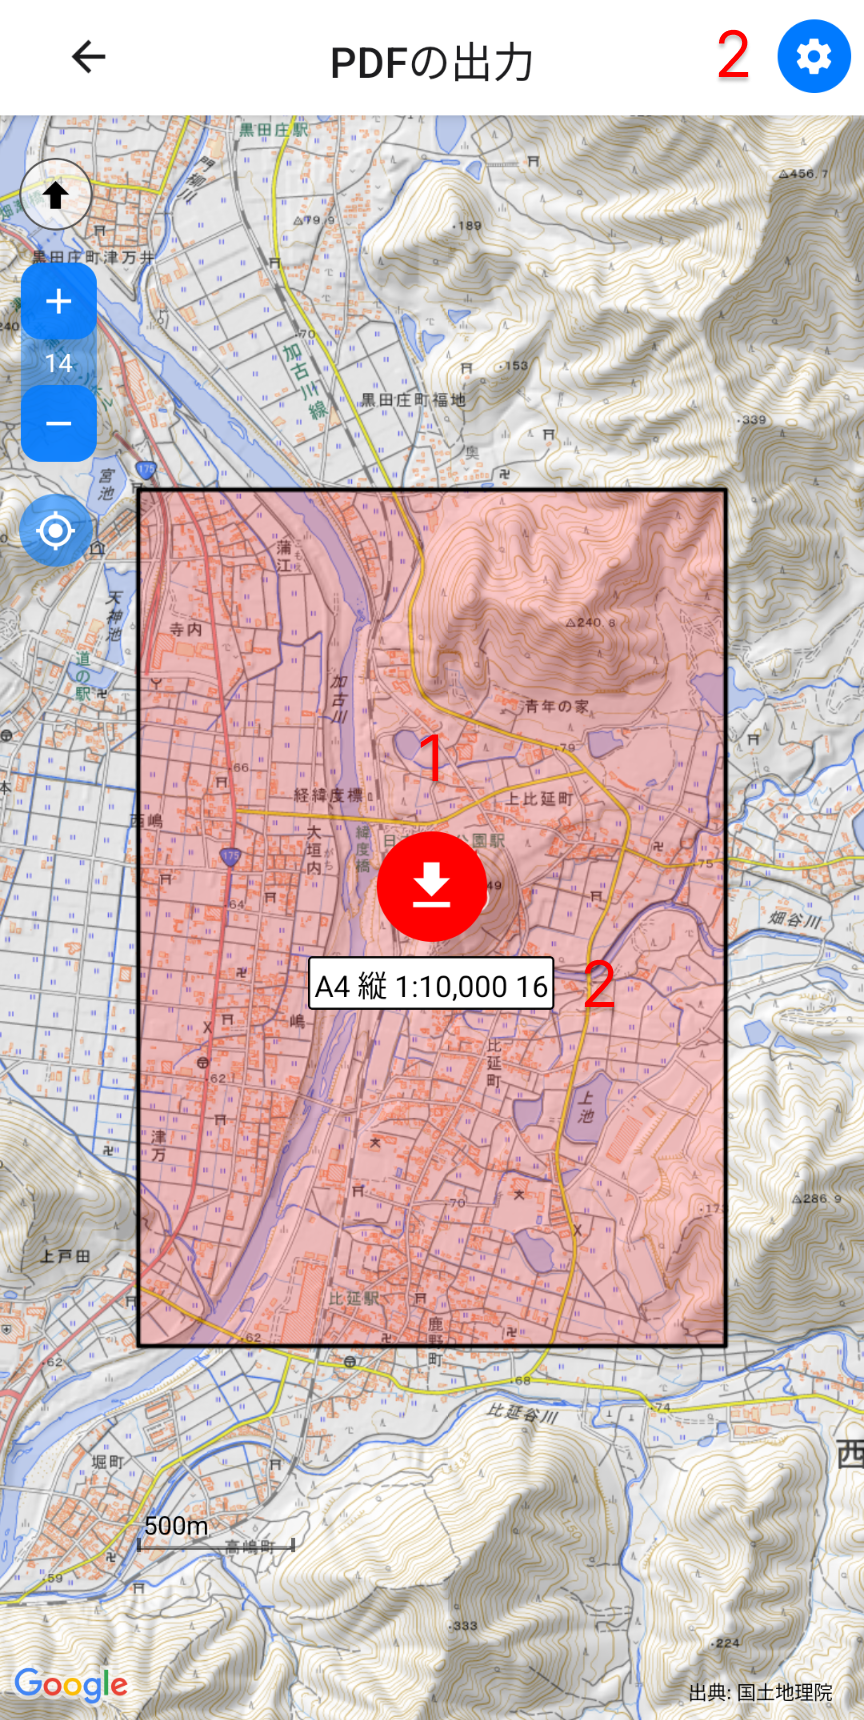
PDF Output
The PDF Output screen outputs maps and location information for a specified range to PDF. The output PDF has location information, so it can be directly loaded into QGIS. Data lists can also be output as PDF. Note that Google Maps and satellite images cannot be output.
 |
 |
(1) PDF Download
Move to the necessary area and range and press the download button to output a PDF.
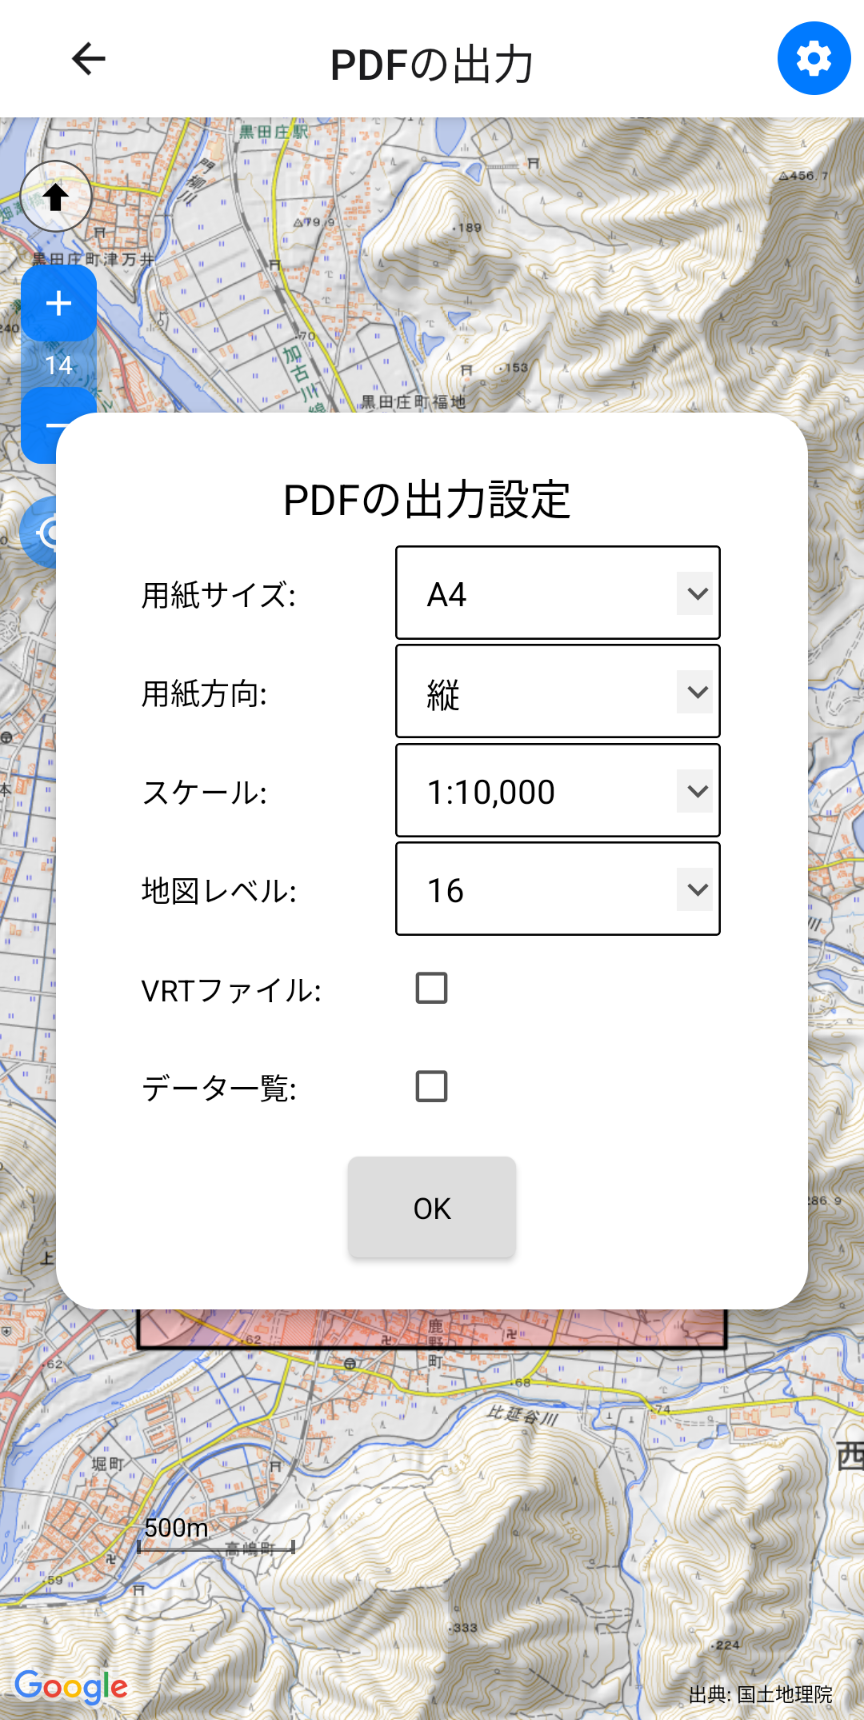
(2) PDF Settings Button
Opens the PDF output settings screen.
- Setting items: Paper size, paper orientation, scale, map level
- Options:
- VRT file: Creates a VRT file for GIS
- Data list: Outputs data in table format
Note: When loading PDFs output from the web version into GIS, please use the VRT file.